Have you ever looked at a set of numbers and wondered which one shows up the most? That’s exactly what the mode in math helps you find.
In simple terms, the mode is the number that occurs most frequently in a dataset. If you’re analyzing your test scores, counting how many students prefer a certain snack, or studying statistics, understanding mode is a key step in interpreting data.
Unlike the mean, which adds all numbers and divides, or the median, which finds the middle value, mode focuses purely on frequency.
This makes it especially useful when you want to know the most common value in a group.
In this article, we’ll break down everything you need to know about mode, including clear examples, comparisons with mean and median, step-by-step calculations, and real-life applications that make statistics easy and practical to understand.
What is Mode in Math?
In mathematics, the mode is one of the measures of central tendency, along with mean and median. Simply put, the mode is the number that appears most frequently in a set of numbers. It helps identify the most common value, which can be very useful in analyzing data. For example, if a teacher records the scores of a class on a math test, the score that occurs most often is the mode.
Unlike the mean, which is influenced by very high or very low numbers, or the median, which only considers the middle value, the mode focuses entirely on frequency. This makes it especially useful for datasets where repetition matters more than overall total or order.
A dataset can have one mode (unimodal), two modes (bimodal), or more than two modes (multimodal). It is also possible for a dataset to have no mode if all numbers appear the same number of times.
Example: Consider the numbers: 4, 7, 4, 9, 4, 6, 7. Here, the number 4 appears three times, more than any other number. Therefore, the mode of this dataset is 4.
Mode is not limited to numbers; it can also apply to categorical data, such as the most popular color of t-shirts in a store or the most common type of fruit in a basket. This flexibility makes mode a versatile and practical concept in both math and real-life situations.
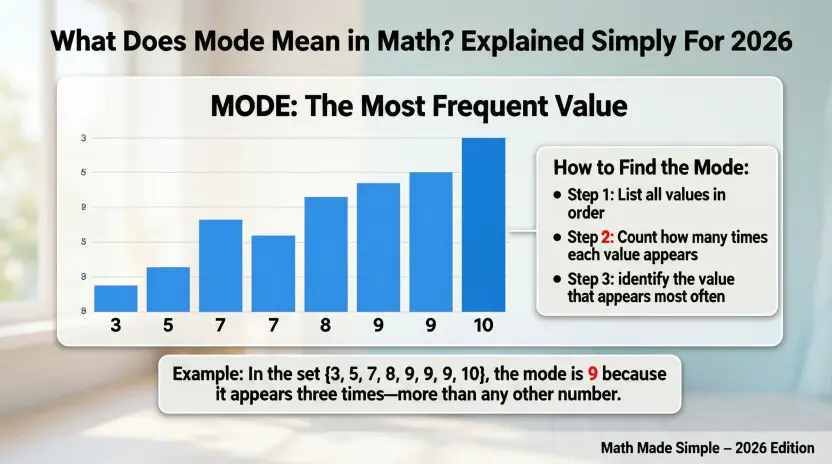
How to Find the Mode: Step-by-Step Guide
Finding the mode in a dataset is simple once you understand the concept of frequency, which is how many times each number appears. Here’s a step-by-step guide to calculate mode:
Step 1: List all the numbers
Write down all the numbers in the dataset so you can easily see repetitions.
Step 2: Count the frequency of each number
Go through each number and count how many times it appears.
Step 3: Identify the number with the highest frequency
The number that appears most often is the mode.
Example: Consider the dataset: 3, 5, 2, 3, 8, 5, 3.
- 3 appears 3 times
- 5 appears 2 times
- 2 appears 1 time
- 8 appears 1 time
Here, 3 appears the most, so the mode is 3.
Step 4: Use a frequency table for larger datasets
For bigger sets, make a table listing each number and its frequency. This makes it easier to spot the mode.
Step 5: Note special cases
- No mode: If all numbers appear the same number of times, the dataset has no mode.
- Multiple modes: If two or more numbers appear with the same highest frequency, the dataset is bimodal or multimodal.
Finding mode is a practical skill that helps quickly identify trends, patterns, or the most common values in both numerical and categorical data.
Examples of Mode in Different Datasets
Understanding mode becomes much easier when we look at real examples. Let’s explore how mode works in various datasets.
Example 1: Small dataset
Consider the numbers: 2, 4, 4, 5, 7.
- 2 appears once
- 4 appears twice
- 5 appears once
- 7 appears once
Here, the number 4 appears most frequently, so the mode is 4.
Example 2: Dataset with multiple modes
Numbers: 3, 6, 3, 6, 9
- 3 appears twice
- 6 appears twice
- 9 appears once
Both 3 and 6 occur the most. This dataset is bimodal, and the modes are 3 and 6.
Example 3: Dataset with no mode
Numbers: 1, 2, 3, 4, 5
Each number appears only once. Since no number repeats, this dataset has no mode.
Example 4: Real-life application
Imagine a teacher recording the favorite fruits of students: apple, banana, apple, orange, banana, apple.
- Apple appears 3 times
- Banana appears 2 times
- Orange appears 1 time
The mode is apple, which tells the teacher the most popular fruit.
Example 5: Large dataset with frequency table
For larger numbers, create a frequency table to easily find the mode. This method avoids mistakes and shows clearly which number is most common.
These examples show that mode can appear in numerical data, categorical data, or even large datasets, making it a versatile and practical tool for both math and everyday life.
Mode vs Mean vs Median
Mode, mean, and median are all measures of central tendency, but they each describe a dataset in different ways. Understanding the differences helps in choosing the right method to analyze data.
Mode:
- The number that appears most frequently in a dataset.
- Useful for identifying the most common value.
- Can be used for numerical and categorical data.
- Example: In the dataset 2, 3, 3, 4, 5, the mode is 3.
Mean (Average):
- The sum of all numbers divided by the total count.
- Influenced by extremely high or low numbers (outliers).
- Example: For 2, 3, 3, 4, 5, the mean is (2+3+3+4+5)/5 = 3.4.
Median:
- The middle value when numbers are arranged in order.
- Not affected by outliers.
- Example: Dataset 2, 3, 3, 4, 5 → the median is 3.
Comparison Table:
| Measure | Definition | Example | Best Use |
| Mode | Most frequent value | 3 | Popular item, trend analysis |
| Mean | Sum ÷ count | 3.4 | Balanced average, overall data |
| Median | Middle value | 3 | Skewed data, avoid outlier influence |
Key Points:
- A dataset can have no mode or multiple modes, but mean and median always exist.
- Mode is ideal for categorical data, while mean and median work best for numerical data.
- Using all three together gives a complete view of a dataset.
By comparing mode, mean, and median, you can choose the best method to summarize and understand data depending on the situation.
Why Mode Matters in Statistics
Mode is more than just a number; it is a powerful tool in statistics that helps identify trends, patterns, and the most common values in a dataset. Unlike the mean or median, mode focuses purely on frequency, which makes it especially useful when understanding what occurs most often.
For example, businesses often use mode to determine the most popular product size or color. A clothing store may find that medium-sized shirts sell the most, which allows them to stock inventory efficiently. Similarly, schools can identify the most common test scores to evaluate overall student performance and understand which concepts may need extra attention.
Mode is also valuable in surveys and polls. When asking a large group of people about their favorite fruit, vacation spot, or music genre, the mode immediately highlights the most preferred choice, helping researchers or marketers make informed decisions.
Another reason mode matters is its application to categorical data. While mean and median require numbers, mode can be applied to non-numerical data, such as colors, brands, or types of pets.
Key Takeaways:
- Mode identifies the most frequent value in a dataset.
- Useful for both numerical and categorical data.
- Helps businesses, teachers, and researchers make decisions based on trends.
- Provides quick insights into the popularity or commonality of values without complex calculations.
Understanding mode is an essential part of statistics because it reveals patterns that other measures like mean or median may overlook, making it a practical tool for everyday decision-making.
Tips & Tricks to Remember Mode Easily
Learning mode becomes much easier when you use simple tips and tricks to remember what it represents and how to find it.
1. Remember the Definition with a Mnemonic
A helpful way to recall mode is: “Mode = Most Often Appearing Digit.” This phrase reinforces that the mode is simply the number that appears most frequently in a dataset.
2. Visualize with Frequency Tables
For larger datasets, creating a frequency table makes it easier to spot the mode. List each number in one column and its frequency in another. The number with the highest frequency is the mode. This method reduces mistakes and works for both small and large sets of numbers.
3. Use a Histogram or Bar Graph
Drawing a bar graph can help visualize the most common value. The tallest bar represents the mode. This is especially useful for students who are visual learners.
4. Check for Special Cases
- No mode: If all numbers appear the same number of times, the dataset has no mode.
- Multiple modes: If two or more numbers occur most frequently, the dataset is bimodal or multimodal. Recognizing this helps avoid confusion.
5. Practice with Real-Life Data
Try finding the mode in everyday situations, such as:
- Your favorite snacks in the fridge
- Most-worn shoes in your closet
- Scores from a recent game
By using these tips, you’ll quickly remember what mode is and be able to identify it effortlessly in any dataset. Visual tools, mnemonics, and real-life examples make mode a practical and memorable concept.
Common Mistakes When Calculating Mode
Even though mode is one of the simplest measures of central tendency, students and beginners often make common mistakes when calculating it. Being aware of these errors can help avoid confusion and ensure accurate results.
1. Misidentifying the Most Frequent Number
Sometimes, people accidentally pick a number that seems “popular” but isn’t actually the one with the highest frequency. Always count carefully to ensure you choose the correct mode.
2. Confusing Mode with Mean or Median
Many beginners mix up mean, median, and mode because all three are measures of central tendency. Remember:
- Mean is the average of all numbers.
- Median is the middle value.
- Mode is the number that appears most often.
3. Ignoring Multiple Modes
A dataset can have more than one mode. For example, in the dataset 2, 3, 3, 5, 5, both 3 and 5 are modes. Ignoring additional modes can lead to incomplete analysis.
4. Assuming Mode Always Exists
Not every dataset has a mode. For example, 1, 2, 3, 4, 5 has no repeating numbers, so it has no mode. Assuming a mode exists in such cases is a common mistake.
5. Forgetting Categorical Data Can Have Mode
Mode is not limited to numbers. Popular items, favorite colors, or types of pets can all have a mode. Overlooking categorical data reduces the usefulness of mode in real-life applications.
Tips to Avoid Mistakes:
- Count carefully or use a frequency table.
- Check for multiple modes.
- Remember that mode may not exist in every dataset.
- Apply mode to both numerical and categorical data for real-life insights.
By avoiding these mistakes, you can calculate mode accurately and use it effectively in statistics and daily life.
Real-Life Applications of Mode
Mode is not just a math concept it is highly useful in real-life situations where understanding the most frequent occurrence matters. By identifying the mode, we can make decisions, spot trends, and simplify data analysis.
1. Education: Teachers often use mode to understand student performance. For example, if a class’s test scores are 70, 75, 70, 80, and 70, the mode is 70. This shows the most common score, helping teachers identify areas where students may need more practice.
2. Retail and Business: Stores use mode to determine the most popular product sizes, colors, or items. If medium-sized t-shirts sell the most, the store can stock more of them. Similarly, supermarkets track which products are purchased most frequently to manage inventory efficiently.
3. Surveys and Polls: When conducting surveys, mode reveals the most preferred choice. For instance, if a survey asks for favorite fruits and most people choose apples, the mode is apple, helping businesses or researchers understand public preference.
4. Sports Statistics: Mode helps analyze performance trends. For example, in soccer, if a player scores 1, 2, 2, 3, 2 goals in different matches, the mode is 2, showing the most common number of goals per game.
5. Everyday Life: Mode can help in daily decisions, like choosing the most used shoes, favorite snacks, or common commute times.
By applying mode in education, business, research, sports, and daily life, we can quickly understand patterns, preferences, and trends, making it a practical and versatile tool for both numerical and categorical data.
Mode in Grouped Data
In some cases, data is organized into groups or intervals, such as age ranges, income brackets, or test score ranges. Finding the mode in such grouped data requires a slightly different approach than with individual numbers, but it is still straightforward.
Step 1: Identify the Modal Class
The modal class is the group or interval with the highest frequency. For example, consider the age distribution of students:
| Age Group | Frequency |
| 10–14 | 5 |
| 15–19 | 12 |
| 20–24 | 8 |
| 25–29 | 4 |
Here, the interval 15–19 has the highest frequency, so it is the modal class.
Step 2: Use the Mode Formula for Grouped Data
The formula to calculate mode is:
Mode=L+f1−f02f1−f0−f2×h\text{Mode} = L + \frac{f_1 – f_0}{2f_1 – f_0 – f_2} \times hMode=L+2f1−f0−f2f1−f0×h
Where:
- LLL = lower boundary of the modal class
- f1f_1f1 = frequency of the modal class
- f0f_0f0 = frequency of the previous class
- f2f_2f2 = frequency of the next class
- hhh = class width
Step 3: Apply the Formula
Using the table above:
- L=15L = 15L=15, f1=12f_1 = 12f1=12, f0=5f_0 = 5f0=5, f2=8f_2 = 8f2=8, h=5h = 5h=5
- Mode = 15 + ((12 − 5) / (2×12 − 5 − 8)) × 5
- Mode = 15 + (7 / 11) × 5 ≈ 15 + 3.18 = 18.18
So, the mode is approximately 18 years.
This method works for large datasets grouped into intervals, providing a more accurate representation of the most frequent value when exact numbers are not listed individually.
FAQs
Many students and beginners have questions about mode. Here are some of the most frequently asked questions with clear answers:
1. What is mode in simple terms?
Mode is the number that appears most frequently in a dataset. It shows the most common value, If in numbers or categories.
2. How do you calculate mode in a dataset?
- List all numbers.
- Count how many times each number appears.
- The number with the highest frequency is the mode.
For large datasets, use a frequency table or a bar graph to identify the mode quickly.
3. Can a dataset have more than one mode?
Yes. If two numbers appear most frequently, it is bimodal. If more than two numbers share the highest frequency, it is multimodal.
4. What if all numbers appear only once?
If no number repeats, the dataset has no mode.
5. How is mode different from mean and median?
- Mean is the average of all numbers.
- Median is the middle value.
- Mode is the most frequent number. Each measure gives a different view of the dataset.
6. Can mode be applied to non-numerical data?
Yes. Mode works for categorical data such as favorite colors, popular brands, or common survey answers.
7. Why is mode important in statistics?
Mode helps identify trends, patterns, and the most common occurrences, making it useful for research, business decisions, and everyday life.
By understanding these FAQs, readers can avoid confusion, calculate mode correctly, and apply it effectively in both mathematical and real-world contexts.
Conclusion
The mode is one of the simplest yet most practical concepts in mathematics and statistics. By definition, it is the number or value that appears most frequently in a dataset.
Unlike the mean, which averages all numbers, or the median, which identifies the middle value, mode focuses entirely on frequency.
This makes it especially useful for understanding trends, patterns, and the most common occurrences in both numerical and categorical data.
Throughout this article, we explored how to calculate mode in simple datasets and in grouped data, using frequency tables, formulas, and visual tools like bar graphs.
We also examined the differences between mode, mean, and median, helping clarify when each measure is most appropriate.
Real-life examples from classroom test scores to favorite products, survey results, and sports statistics show how mode can be applied beyond the classroom to everyday decision-making.
It is important to remember that a dataset can have one mode, multiple modes, or no mode at all. Mode can also apply to categorical data, which sets it apart from mean and median.
Understanding mode not only strengthens statistical knowledge but also provides practical insights that can guide business decisions, educational strategies, and research findings.
By practicing with real numbers and daily data, you can quickly become confident in identifying the mode, interpreting datasets, and applying this versatile tool effectively.
Mode may seem simple, but its applications make it a powerful and essential concept in both mathematics and real life.

“ASF — Discipline, Duty & Determination. A mind trained for focus, a heart built on courage, and a spirit that never backs down. Living by principles, acting with purpose, and leading with strength. Silence in action, power in presence, and pride in every step. Always ready, always alert. Explore more at thepunside.com.”